What’d We Learn from Last Season
“Lesson, lesson…If you see a stranger, follow him.” - Edward from Cowboy Bebop*
*Please do not do this.Photo Credit: Kyle Hess/Georgia Swarm
Last season was the first full year of my mammoth project tracking a wealth of team stats to help identify where NLL teams had successes at different facets of the box game. All that data begs the question: what’d we learn from the 2022-23 season?
I think we learned a lot while reinforcing notions we already had, like 5-on-5 being the most important part of the game — for example, teams that win the 5-on-5 game won 107 games last season, an 87.7 W%. But it also showed us some more surprising aspects to teams and the league, and since I didn’t get to review them last season for the Flash, might as well do it now before the 2023-24 season kicks off.
Some fun stuff that sticks out to me league-wide:
We learned how much time teams play the settled (5-on-5) game — 62.7% of total shifts.
The NLL is such a goalie-centeric league. Postseason teams had a starting netminder play 900 minutes for them between the pipes and have a positive GSAA, except for one team; more on that later.
Sticking with goalies for a second, Christian Del Bianco was a monster last season. His 31.60 GSAA is the second best regular season number for a starter* for this statistic since 2005 (the furthest back we have NLL data publicly available). The only player to have a better season was Matt Vinc with the Knighthawks in 2013, when he finished with an astonishing 34.68 GSAA. Vinc’s number last season? 22.61.
Expanding back to the league, I personally never liked how we presented the stats for special teams — power play and penalty kill. Yeah, inherited from hockey and all that jazz, but I cared more about how often a team had a power play or penalty kill set and scored or prevented an opponent from netting a PPG. PPE% was 19.55, and PKE% was 80.45.
A surprising 22.0% of all even strength sets resulted in no shot being recorded on goal. That means 6,411 sets 5-on-5 last season were lost.
Penalty shots aren’t automatic, as it had a 58.3 S%. At least the SOG% was perfect; I do sadistically hope someone takes a penalty shot and misses just because of how rare that would be.
Analysts like to opine that multiple possessions tend to favor an offense. I never really agreed with that, so I tracked it. Sticking with even strength numbers since that’s where most of a game is played, the ESE% was 11.4%; MPE% was 13.6%. Split the average of 16.2 MPSets per game between two teams, and that means offenses were scoring a little more than 1 in 8 times after getting a reset.
Teams averaged 3.7 failed clears per game. The worst team at it? A tie between the Mammoth and Desert Dogs at 82 total for the season. The team whose opponents threw the ball away or had neutral zone turnovers caused against them the most? The Seals at 112, 22 more than the next closest team.
We saw the continued trend of winning or losing the face-off game not really impacting the final results; teams were 67-67 when they won more draws, and there was only game where the teams tied for FOW, meaning it was a coin flip whether your team won or lost a game last season if they dominated the dot.
*(minimum 500 minutes played in a season, otherwise Derek Collins’ 47.00 GSAA with the Rochester Knighthawks would be the highest, a season he played 93:20 minutes in)
Photo Credit: Buffalo Bandits
What about a standout stat for each team? Well…
Albany FireWolves
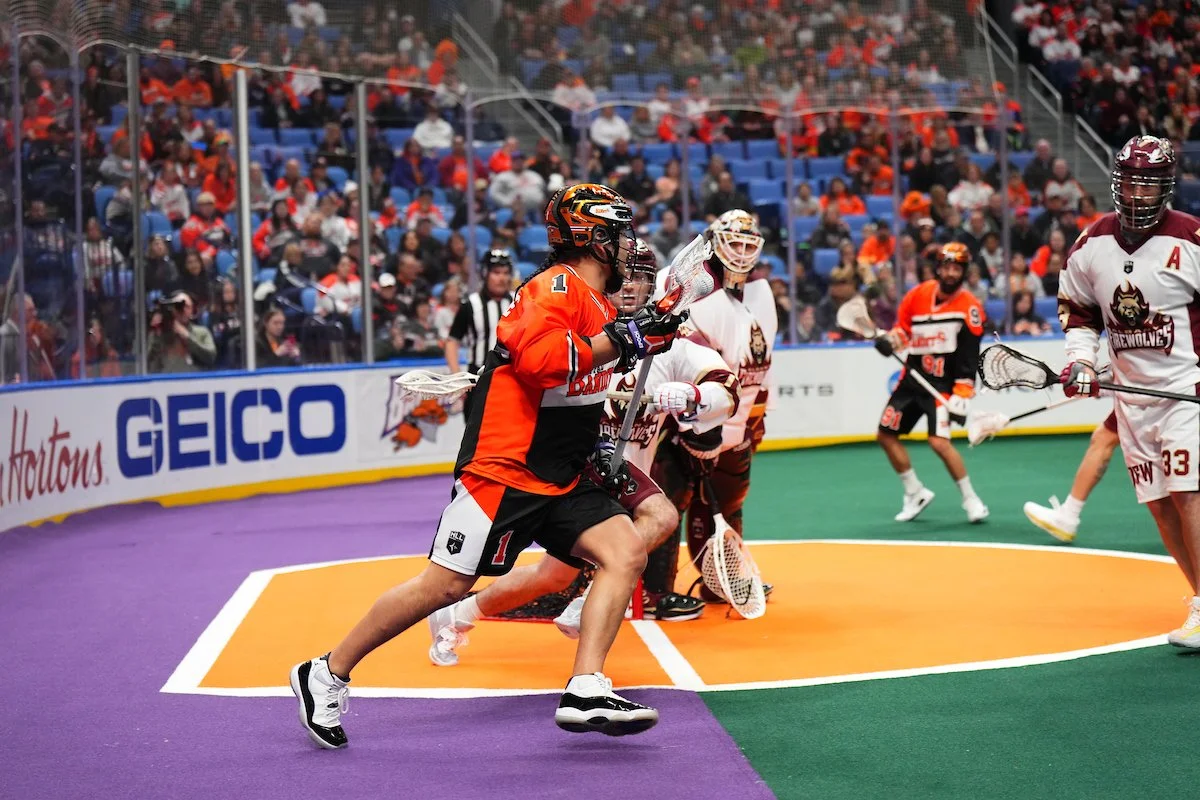
They had a rough season all around. Pick a category, and they were pretty subpar. But two numbers are interesting to me. They didn’t have a single empty netter goal all season; hell, they didn’t have a single empty netter set in any of their 18 games.Buffalo Bandits
The eventual 2022-23 NLL Champions had more sets than their opponents in just seven games. Their record in those games? 4-3, meaning they were 10-1 in games opponents had more combined sets.Calgary Roughnecks
The Roughnecks defense was the best at the settled game, with a 9.3 ESE% against. They’re one of two teams to have an ESE% in single digits. Part of that was MVP and Goaltender of the Year Christian Del Bianco spent all but 14 seconds between the pipes. That one game was an 11-9 loss to the Desert Dogs on Feb. 24. His replacement, Adam Bland, didn’t see a shot.Colorado Mammoth
The runner-ups had the least amount of offensive FBSets at 153, 20 less than the next worst team, the Wings. They were also the only playoff team to have a negative goal differential.Georgia Swarm
Not surprisingly, the Swarm didn’t win the even strength game until their first victory on Feb. 25 against the FireWolves, a game where the FireWolves wouldn’t record a single settled marker. Through their last 11 games of the season, the only time the Swarm didn’t win the 5-on-5 portion of the game were also their only three loses in that span.Halifax Thunderbirds
You like goals scored on broken plays? So did the Thunderbirds. They had the most unsettled shifts for in the NLL with 59, which was 3.4% of their total offensive sets. They also led the league in unsettled goals with 8. The weirdest stat? That 3.4% and 8 USG were both tied with the Knighthawks for best in those statistical categories.
Photo Credit: Behind the Lens Sports Photography/Las Vegas Desert Dogs
Las Vegas Desert Dogs
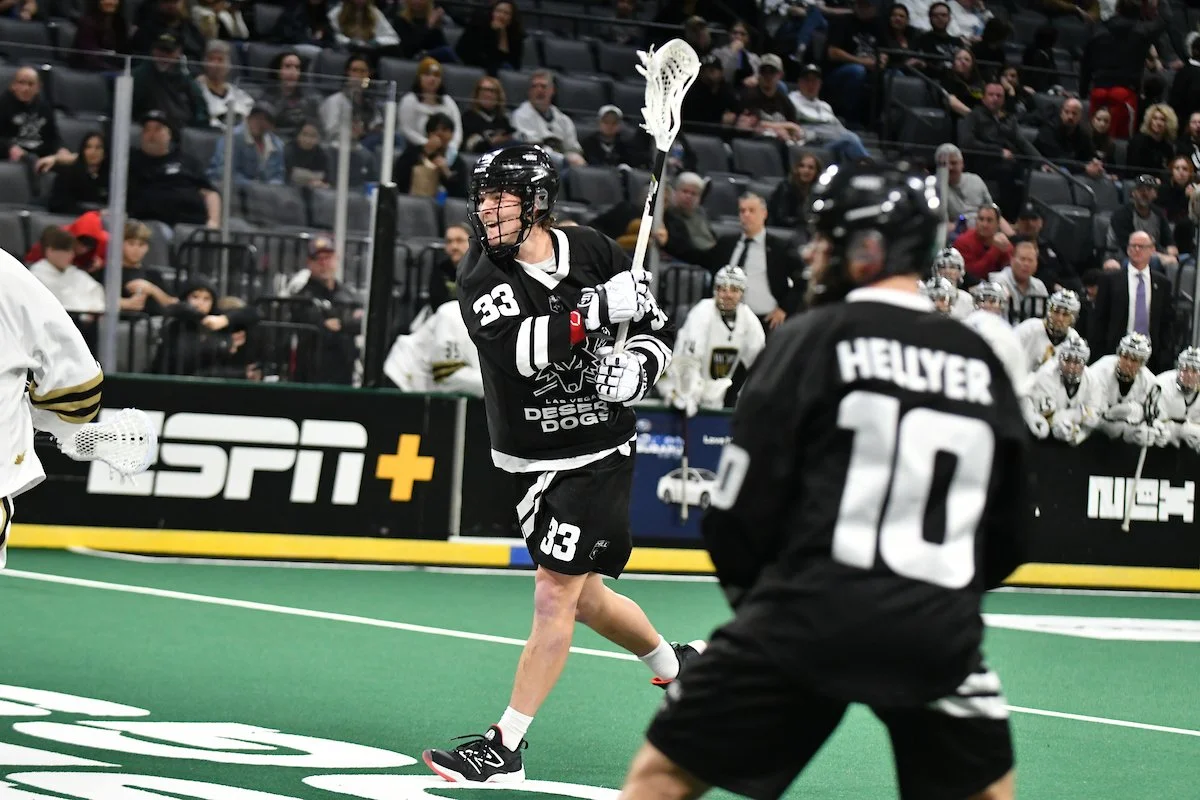
The newest NLL team didn’t have a single goal type differential that was in the positives. Their best goal type differential was the zero in the unsettled category, where they scored and gave up 10 USG.New York Riptide
The defensive issues last season for the Riptide were harped on quite a bit, but here’s one more string to twang: they had the worst S/GAME differential in the NLL at -252 (40 more than the next worse team). Spotting the opponent 14 extra shots per game takes its toll.
Panther City LC
The only NLL team to make the postseason with a severely underperforming even strength game, PCLC shrugged off their -19 ES goal differential by dominating the power play (23.8 PPE%, +9) and fast breaks (20.3 FBE% , +17). They literally outran their settled problems.
Philadelphia Wings
Philly got hammered in reverse transition. Their 274 FBSets against was 17.3% of their defensive sets, the worst marker in the league; however, opponents only cashed in on 10.2% of those chances, the lowest FBE% against by almost two percentage points.Rochester Knighthawks
The Knighthawks played my favorite regular season game of last year, a 9-8 loss to the Wings on March 19 where no penalties were awarded. It’s the only game to not have a power play set of any kind. Both teams scored 7 ESG each, but the 1 USG for the Knighthawks was outweighed by 2 FBG for the Wings. With a FBSOG% of 42.9%, the KHawks weren’t really taking their best transition shots that game.San Diego Seals
I didn’t touch on it in last season’s stats primer, but I use GSAA to show how many shots a goalie saves compared to an average NLL netminder in a season. Four teams had all of their respective goalies finish with negative GSAA numbers; only one of those teams finished 14-4: the Seals. (The other three teams were ALB, LV, and SAS — none of them had winning records)Saskatchewan Rush
The Rush transition game was stronger than you remember, at least going from D to O. 287 of their sets (PPT and FB) were in transition, 18.6% of their total sets, which is the highest percentage for last season. Sadly, they were .500 in games where they outscored their opponents while outrunning them.Toronto Rock
The Rock were more of an avalanche last season. They led the NLL in the following goal and shot differentials: +41 ESG, +23 FBG, +3 PSG, +308 S/GAME, +204 SOG/GAME.Vancouver Warriors
The Warriors had the worst defense last season, and it’s not particularly close. Settled or in reverse transition, they weren’t having success anywhere. But most notable was their 75.12 PKE% against, the worst percentage in the NLL. It’s part of why their revamped defense is so interesting, because they literally couldn’t be worse than last year.
Can’t wait to see what we learn this season.


