Everyone at Four — Small Sample Size No More
All 14 NLL teams have 4 games under their belt, meaning we’re past the realm of small sample sizes; time to find out who’s the best and worst at all facets of the game.
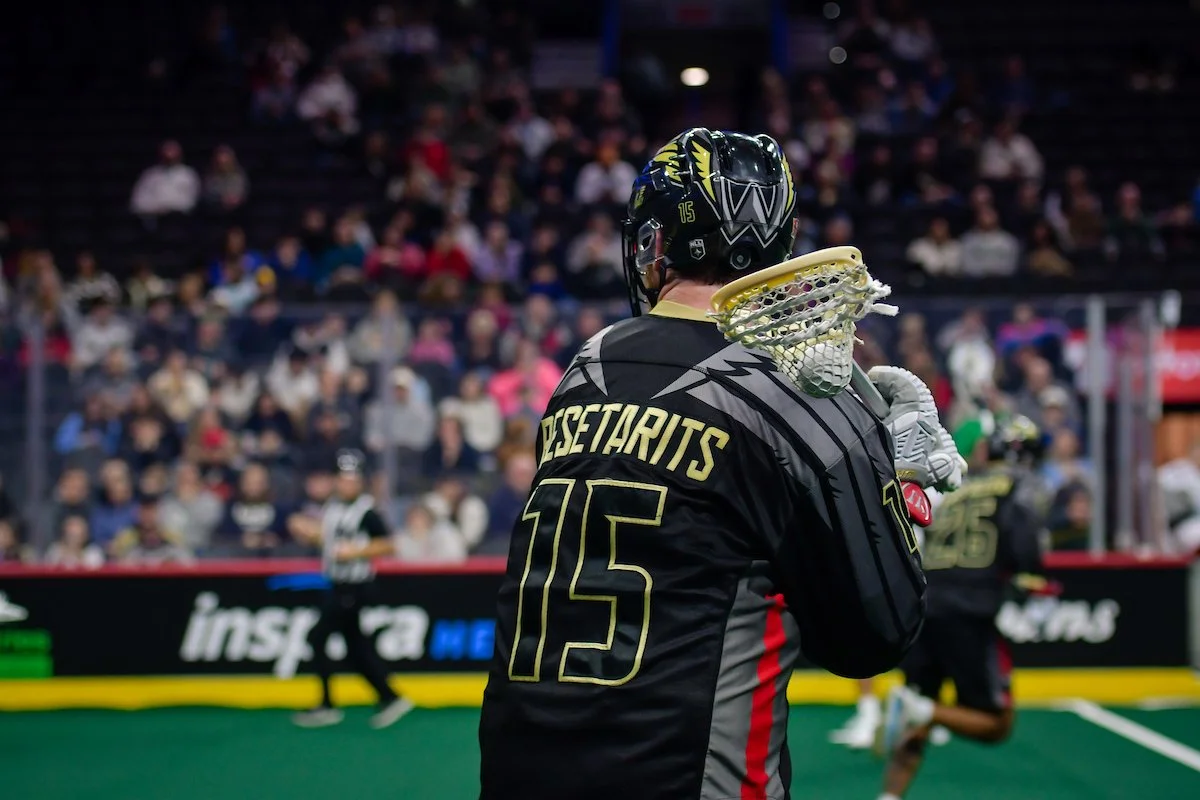
Photo Credit: Jordan Leigh/Vancouver Warriors
It took seven weekends, but we are finally at the point where every National Lacrosse League team has at least four games under their respective belts. Hell, six of them have at least 6 games played, with one — Rochester Knighthawks — at 7 games played.
The Bandits, Roughnecks, and Warriors brought up the rear to four, the byproduct of a momentum-ruining amount of bye weeks early on in the schedule. But those gaps in their schedule haven’t really affected too much for them.
As is tradition (established 2024), I’ll look at the data I have and rank teams based on shift type efficiency, listing out the goals for/against. Given the disparity in number of games played, it’s not fair to rank teams by that number; doing this by goals for or against isn’t necessarily the best way to say who’s excelling/plain bad or doesn’t really tell the whole story. Efficiency looks at the number of opportunities and how often teams are capitalizing on said opportunities, which is why I like it.
Small sample size is for lazy people who like good overreactions. Don’t be those people. Be these people, reading the rest of this article and seeing which teams are the best at TrueES, TruePP, and TrueFB and which goalies are hot or not.
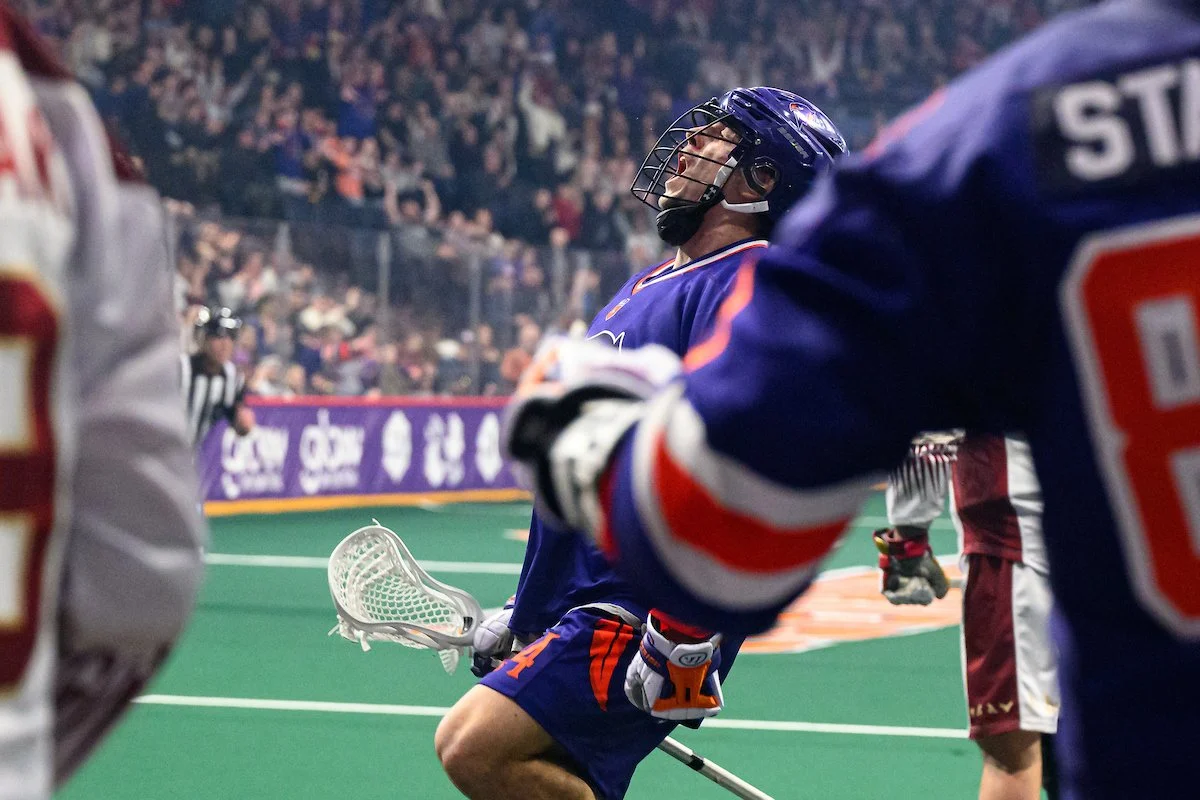
Photo Credit: Ryan Nix/Philadelphia Wings
Everyone at Four
Like last year, this section will be plenty of lists and not much commentary beyond random thoughts that pop up into my head while I’m working on this article. If they’re in the best category, they’re probably pretty good. If they’re in the worst category, improvement’s needed; as simple as simple gets. Any questions about what a team’s inclusion/exclusion from these lists means should be directed to me via the DM of whatever social media platform probably brought you here. As long as you’re not antagonistic, I don’t mind explaining.
As is tradition, we start with the most and least efficient even strength offenses (TrueES, a combination of 5-on-5 and 4-on-4).
Best 5-on-5 Offenses by TrueESE%
| Team | GF | S% | SOG% | E% | LP% |
|---|---|---|---|---|---|
| Philadelphia Wings | 51 | 21.0% | 71.6% | 18.5% | 22.1% |
| Colorado Mammoth | 55 | 20.8% | 65.7% | 17.4% | 24.1% |
| Buffalo Bandits | 35 | 18.6% | 70.7% | 16.4% | 23.0% |
| Halifax Thunderbirds | 41 | 16.8% | 69.3% | 15.2% | 20.0% |
| Calgary Roughnecks | 25 | 15.0% | 72.5% | 12.5% | 23.5% |
I’m high on the Mammoth just because of their offense. I think most people attribute Colorado’s success to their Mammoth D, but there’s just something special about a lineup with Ryan Lee, Connor Kelly, Zed Williams, Eli McLaughlin, and Connor Robinson in it.
Worst 5-on-5 Offenses by TrueESE%
| Team | GF | S% | SOG% | E% | LP% |
|---|---|---|---|---|---|
| Vancouver Warriors | 15 | 9.1% | 74.4% | 7.6% | 24.7% |
| Toronto Rock | 19 | 9.1% | 68.4% | 8.3% | 18.3% |
| Las Vegas Desert Dogs | 26 | 10.5% | 72.1% | 9.1% | 18.2% |
| Albany FireWolves | 30 | 10.3% | 66.4% | 9.3% | 21.7% |
| Ottawa Black Bears | 29 | 12.7% | 71.1% | 10.7% | 24.6% |
An offense with Jeff Teat in it is bad 5-on-5? What is this, last season? Oh, wait…
Best 5-on-5 Defenses by TrueESE%
| Team | GA | S% | SOG% | E% | LP% |
|---|---|---|---|---|---|
| Vancouver Warriors | 16 | 9.4% | 61.2% | 8.3% | 24.4% |
| Saskatchewan Rush | 26 | 11.1% | 63.8% | 9.3% | 25.4% |
| Ottawa Black Bears | 26 | 12.4% | 70.8% | 10.4% | 23.2% |
| Colorado Mammoth | 33 | 12.0% | 72.4% | 10.5% | 20.4% |
| San Diego Seals | 29 | 14.0% | 70.0% | 10.6% | 31.5% |
I really try not to say outright which team is generally the best/worst in the NLL. There are a lot of factors that contribute to general arguments like that, and it’s a bit foolhardy to say X team is better than Y teams because of shooting percentage or goals against or whatever.
I don’t have that problem here. The Warriors defense is the best in the NLL — you’ll see why — and it’s why no one should worry too much about their offensive woes (exception being the Warriors coaching staff).
Worst 5-on-5 Defenses by TrueESE%
| Team | GA | S% | SOG% | E% | LP% |
|---|---|---|---|---|---|
| Las Vegas Desert Dogs | 63 | 9.2% | 71.3% | 16.8% | 21.4% |
| Calgary Roughnecks | 32 | 16.7% | 71.4% | 15.5% | 19.4% |
| Halifax Thunderbirds | 40 | 17.4% | 66.1% | 15.2% | 22.0% |
| Rochester Knighthawks | 51 | 14.7% | 69.5% | 13.7% | 17.2% |
| Georgia Swarm | 45 | 15.2% | 70.7% | 13.4% | 21.1% |
No real surprises here except for the Desert Dogs being not just bad but as atrocious as they are even strength. 63 ESGA is bonkers. That’s three goals less than what the Rush defense has given up across all shift types all season long.
Spoiler alert, I guess: This issue will crop up throughout this article for the Desert Dogs. Their defense and goaltending have been putrid. Time will tell if Justin Geddie between the pipes and the newly acquired (and underrated) Drew Belgrave help improve Las Vegas’s back end.
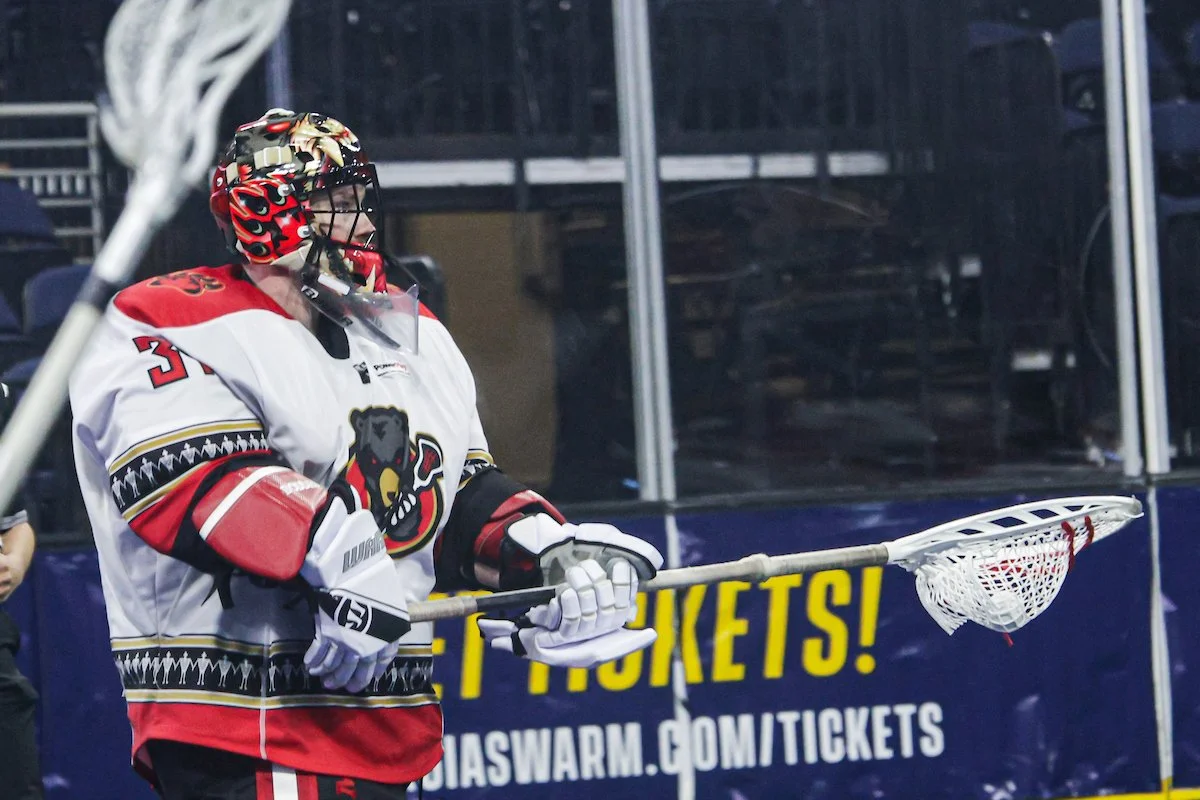
Photo Credit: Trevor MacMillian/Halifax Thunderbirds
5-on-4 is a prime opportunity to score. Here are the best teams at taking advantage of opposing penalties, TruePP (5-on-4 “settled” and transition; TruePK is the defensive version).
Best Power Play Units by TruePPE%
| Team | GF | S% | SOG% | E% | LP% |
|---|---|---|---|---|---|
| Philadelphia Wings | 13 | 28.9% | 80.0% | 27.1% | 14.6% |
| Calgary Roughnecks | 17 | 23.0% | 66.2% | 25.0% | 14.7% |
| Albany FireWolves | 16 | 24.6% | 76.9% | 22.2% | 19.4% |
| Halifax Thunderbirds | 11 | 23.4% | 74.5% | 22.0% | 14.0% |
| Vancouver Warriors | 10 | 18.2% | 65.5% | 20.4% | 8.2% |
The Wings defense is better than I expected this season. Even if they were close to what I did expect (similar to last season), I’m half-convinced their offense could outshoot those preseason hypothetical defensive issues. Best even strength and power play units in the NLL, and it’s not really close.
Also, the FireWolves are having the inverse of their power play problems from last season. They were pitiful 5-on-4 despite a 6-0 record; now, they’re cashing in on special teams but have the second worst record in the league. Sportsball.
Worst Power Play Units by TruePPE%
| Team | GF | S% | SOG% | E% | LP% |
|---|---|---|---|---|---|
| Saskatchewan Rush | 9 | 12.3% | 72.6% | 12.9% | 14.3% |
| Rochester Knighthawks | 12 | 11.5% | 69.2% | 13.8% | 5.7% |
| Colorado Mammoth | 11 | 12.8% | 67.4% | 14.1% | 14.1% |
| Buffalo Bandits | 7 | 13.0% | 55.6% | 14.6% | 8.3% |
| Georgia Swarm | 11 | 16.4% | 77.6% | 14.9% | 17.6% |
The Swarm power play has been hot and cold this season. In half their games, their TruePPE% is above league average; in the other half, it’s pitiful, with last Friday’s zero PPG on four Black Bears’ penalties the most glaring example of a power play unit that can’t get consistent.
Best Penalty Kill Units by TruePKE%
| Team | GA | S% | SOG% | E% | LP% |
|---|---|---|---|---|---|
| Buffalo Bandits | 7 | 9.9% | 52.1% | 11.9% | 10.2% |
| Ottawa Black Bears | 7 | 12.1% | 69.0% | 13.5% | 9.6% |
| Vancouver Warriors | 11 | 14.1% | 64.1% | 14.9% | 12.2% |
| Toronto Rock | 10 | 16.9% | 66.1% | 16.1% | 17.7% |
| Rochester Knighthawks | 14 | 14.7% | 67.4% | 16.7% | 6.0% |
Paul Dawson as essentially a second goalie on the penalty kill is unfair.
Worst Penalty Kill Units by TruePKE%
| Team | GA | S% | SOG% | E% | LP% |
|---|---|---|---|---|---|
| Georgia Swarm | 9 | 22.5% | 75.0% | 24.3% | 8.1% |
| Colorado Mammoth | 17 | 24.3% | 71.4% | 23.9% | 18.3% |
| Calgary Roughnecks | 10 | 22.7% | 86.4% | 21.3% | 14.9% |
| Las Vegas Desert Dogs | 14 | 20.3% | 79.7% | 21.2% | 15.2% |
| Philadelphia Wings | 30 | 17.7% | 67.7% | 20.0% | 5.5% |
Photo Credit: San Diego Seals
Off the short bench, coast-to-coast, or after a clean face-off win, transition comes in all shapes, TrueFB (traditional transition, fast breaks 5-on-4 and shorthanded).
Best Transition Offense by TrueFBE%
| Team | GA | S% | SOG% | E% | LP% |
|---|---|---|---|---|---|
| Vancouver Warriors | 13 | 30.2% | 79.1% | 27.1% | 14.6% |
| Ottawa Black Bears | 8 | 29.6% | 66.7% | 21.1% | 31.6% |
| Albany FireWolves | 13 | 24.5% | 79.2% | 20.0% | 20.0% |
| San Diego Seals | 10 | 25.0% | 77.5% | 20.0% | 22.0% |
| Georgia Swarm | 17 | 22.7% | 69.3% | 20.0% | 14.1% |
Ottawa being on here despite a relatively low per game average (they’ve the second lowest TrueFBG/GAME at 1.6) isn’t that surprising. Efficiency is the name of the game. They and San Diego make the most of the few fast break shifts they enjoy.
Worst Transition Offense by TrueFBE%
| Team | GA | S% | SOG% | E% | LP% |
|---|---|---|---|---|---|
| Philadelphia Wings | 5 | 13.5% | 67.6% | 11.4% | 15.9% |
| Las Vegas Desert Dogs | 16 | 16.0% | 73.0% | 13.4% | 16.0% |
| Rochester Knighthawks | 15 | 18.1% | 72.3% | 16.5% | 14.3% |
| Colorado Mammoth | 10 | 20.0% | 78.0% | 17.2% | 20.7% |
| Toronto Rock | 11 | 21.6% | 66.7% | 17.7% | 22.6% |
The Rock are fifth worst for a second season running, and it’s eerie. Their TrueFBE% is a tenth of a percentage point better than last year. As with everything, injuries (i.e., no Latrell Harris) have really taken their toll on Toronto.
Best Transition Defense by TrueFBE%
| Team | GA | S% | SOG% | E% | LP% |
|---|---|---|---|---|---|
| Buffalo Bandits | 4 | 11.4% | 62.9% | 10.3% | 17.9% |
| Las Vegas Desert Dogs | 6 | 13.6% | 72.7% | 11.5% | 17.3% |
| Albany FireWolves | 10 | 15.2% | 68.2% | 13.9% | 13.9% |
| Philadelphia Wings | 13 | 17.3% | 76.0% | 15.9% | 11.0% |
| Vancouver Warriors | 6 | 18.8% | 71.9% | 16.2% | 16.2% |
Positive sign for the Desert Dogs — they don’t cash in on transition as much as they should considering how much they love to try and score on the run, but they do a good job in reverse transition against opponents.
Worst Transition Defense by TrueFBE%
| Team | GA | S% | SOG% | E% | LP% |
|---|---|---|---|---|---|
| Toronto Rock | 13 | 29.5% | 81.8% | 24.5% | 20.8% |
| Halifax Thunderbirds | 17 | 28.3% | 78.3% | 24.3% | 15.7% |
| Georgia Swarm | 14 | 28.6% | 79.6% | 22.2% | 27.0% |
| San Diego Seals | 16 | 22.5% | 71.8% | 20.5% | 9.0% |
| Calgary Roughnecks | 8 | 20.0% | 77.5% | 19.5% | 7.3% |
Photo Credit: Kyle Hess/Georgia Swarm
You’ll see familiar names in these categories and some surprises. The 2024-25 NLL season has been tumultuous for those between the pipes, and the best and worst NLL goalies by GSAA reflects that. Last season had a smaller disparity between the best and worst; this season, GSAA is top and bottom heavy. Losing a team really affects the spread, as does no Christian Del Bianco playing.
GSAA, as a quick reminder, means Goals Saved Above Average. The quick math behind it is you add up everyone’s saves and shots against to get the league-average save percentage. Then you throw that number into a boring formula, and based off the number of saves a goalie has made, it tells us how many more or less shots a goalie did or did not stop. Positive numbers are good; negative numbers are bad.
Best Starting Netminders by GSAA
| Goalie | Min. | GA | SV | GAA | Sv% | GSAA |
|---|---|---|---|---|---|---|
| Vinc, Matt | 235:13 | 33 | 154 | 8.42 | .824 | 8.49 | Jamieson, Doug | 363:10 | 65 | 257 | 10.74 | .799 | 6.44 | Walsh, Aden | 239:59 | 36 | 154 | 9.00 | .811 | 6.15 | Higgins, Zach | 295:08 | 48 | 196 | 9.76 | .803 | 6.13 | Scigliano, Frank | 316:05 | 50 | 192 | 9.49 | .793 | 3.69 |
The defense in front of him is arguably the best in the NLL, and Aden Walsh’s giant step forward in his game is right there with them. While I’ve concerns with the Warriors offense, I have absolutely none about their defense because of how Walsh has been playing. Damn has he been impressive.
Worst Starting Netminders by GSAA
| Goalie | Min. | GA | SV | GAA | Sv% | GSAA |
|---|---|---|---|---|---|---|
| Kells, Landon | 308:35 | 76 | 218 | 14.78 | .741 | -10.78 | Hutchison, Drew | 130:31 | 32 | 81 | 14.71 | .717 | -6.93 | MacLeod, Cam | 223:05 | 52 | 155 | 13.99 | .749 | -6.08 | Rose, Nick | 268:08 | 55 | 169 | 12.31 | .754 | -5.31 | Hill, Warren | 176:45 | 40 | 117 | 13.58 | .745 | -5.17 |
Fun fact: Landon Kells and Warren Hill were both in the worst category last season. The more things change, the more they stay the same.
Someone’s wondering how the Thunderbirds can have two goalies in the worst category. I didn’t distinguish between minutes at a certain threshold, and even if I had, there are six goalies between Hill and the worst goalie with 100 minutes played (Brett Dobson at -0.44), and none of those six netminders have a full game under their belt yet. Drew Hutchison and Hill have seen at least two full games, and neither have been great/the Thunderbirds defense has been bad in front of both.


